GenomicRanges: Genomic analysis

GenomicRanges is a Python package designed to handle genomic locations and facilitate genomic analysis. It is similar to Bioconductor’s GenomicRanges and uses the IRanges packages (tutorial here) under the hood to manage and provide interval-based arithmetic operations.

An IRanges holds a start position and a width, and is typically used to represent coordinates along a genomic sequence. The interpretation of the start position depends on the application; for sequences, the start is usually a 1-based position, but other use cases may allow zero or even negative values, e.g., circular genomes. IRanges uses nested containment lists under the hood to perform fast overlap and search-based operations.

The package provides a GenomicRanges class to specify multiple genomic elements, typically where genes start and end. Genes are themselves made of many subregions, such as exons, and a GenomicRangesList enables the representation of this nested structure.

Moreover, the package also provides a SeqInfo class to update or modify sequence information stored in the object. Learn more about this in the GenomeInfoDb package.

The GenomicRanges class is designed to seamlessly operate with upstream packages like RangeSummarizedExperiment or SingleCellExperiment representations, providing consistent and stable functionality.

Note

These classes follow a functional paradigm for accessing or setting properties, with further details discussed in functional paradigm section.

Installation

To get started, install the package from PyPI

pip install genomicranges

Construct a GenomicRanges object

We support multiple ways to initialize a GenomicRanges object.

Preferred way

To construct a GenomicRanges object, we need to provide sequence information and genomic coordinates. This is achieved through the combination of the seqnames and ranges parameters. Additionally, you have the option to specify the strand, represented as a list of “+” (or 1) for the forward strand, “-” (or -1) for the reverse strand, or “*” (or 0) if the strand is unknown. You can also provide a NumPy vector that utilizes either the string or numeric representation to specify the strand. Optionally, you can use the mcols parameter to provide additional metadata about each genomic region.

from genomicranges import GenomicRanges
from iranges import IRanges
from biocframe import BiocFrame
from random import random

gr = GenomicRanges(
    seqnames=[
        "chr1",
        "chr2",
        "chr3",
        "chr2",
        "chr3",
    ],
    ranges=IRanges([x for x in range(101, 106)], [11, 21, 25, 30, 5]),
    strand=["*", "-", "*", "+", "-"],
    mcols=BiocFrame(
        {
            "score": range(0, 5),
            "GC": [random() for _ in range(5)],
        }
    ),
)

print(gr)
GenomicRanges with 5 ranges and 5 metadata columns
    seqnames    ranges          strand     score                 GC
       <str> <IRanges> <ndarray[int8]>   <range>             <list>
[0]     chr1 101 - 112               * |       0 0.7012218925416509
[1]     chr2 102 - 123               - |       1 0.3590659642791052
[2]     chr3 103 - 128               * |       2 0.8513214587620568
[3]     chr2 104 - 134               + |       3 0.8310081010510505
[4]     chr3 105 - 110               - |       4  0.772390679404933
------
seqinfo(3 sequences): chr1 chr2 chr3
/opt/hostedtoolcache/Python/3.9.18/x64/lib/python3.9/site-packages/genomicranges/SeqInfo.py:348: UserWarning: 'seqnames' is deprecated, use 'get_seqnames' instead
  warn("'seqnames' is deprecated, use 'get_seqnames' instead", UserWarning)
Note

The input for mcols is expected to be a BiocFrame object and will be converted to a BiocFrame in case a pandas DataFrame is supplied.

From UCSC or GTF file

You can also import genomes from UCSC or load a genome annotation from a GTF file. This requires installation of additional packages pandas and joblib to parse and extract various attributes from the gtf file.

Note

A future version of this package might implement or take advantage of existing genomic parser packages in Python to support various file formats.

import genomicranges

# gr = genomicranges.read_gtf(<PATH TO GTF>)

# OR

human_gr = genomicranges.read_ucsc(genome="hg19")
print(human_gr)
/opt/hostedtoolcache/Python/3.9.18/x64/lib/python3.9/site-packages/genomicranges/SeqInfo.py:348: UserWarning: 'seqnames' is deprecated, use 'get_seqnames' instead
  warn("'seqnames' is deprecated, use 'get_seqnames' instead", UserWarning)
GenomicRanges with 1760959 ranges and 1760959 metadata columns
        seqnames                ranges          strand    source    feature  score  frame                                    group      gene_id
           <str>             <IRanges> <ndarray[int8]>    <list>     <list> <list> <list>                                   <list>       <list>
      0     chr1         11869 - 14362               + | refGene transcript      .      . gene_id "LOC102725121"; transcript_id... LOC102725121
      1     chr1         11869 - 12227               + | refGene       exon      .      . gene_id "LOC102725121"; transcript_id... LOC102725121
      2     chr1         12613 - 12721               + | refGene       exon      .      . gene_id "LOC102725121"; transcript_id... LOC102725121
             ...                   ...             ... |     ...        ...    ...    ...                                      ...          ...
1760956     chr6 159050762 - 159050851               + | refGene       exon      .      . gene_id "TMEM181"; transcript_id "NR_...      TMEM181
1760957     chr6 159052355 - 159052518               + | refGene       exon      .      . gene_id "TMEM181"; transcript_id "NR_...      TMEM181
1760958     chr6 159052842 - 159056461               + | refGene       exon      .      . gene_id "TMEM181"; transcript_id "NR_...      TMEM181
        transcript_id    gene_name exon_number      exon_id
               <list>       <list>      <list>       <list>
      0     NR_148357 LOC102725121         nan          nan
      1     NR_148357 LOC102725121           1  NR_148357.1
      2     NR_148357 LOC102725121           2  NR_148357.2
                  ...          ...         ...          ...
1760956     NR_164859      TMEM181          15 NR_164859.15
1760957     NR_164859      TMEM181          16 NR_164859.16
1760958     NR_164859      TMEM181          17 NR_164859.17
------
seqinfo(54 sequences): chr1 chr10 chr11 ... chrUn_gl000241 chrX chrY

Pandas DataFrame

If your genomic coordinates are represented as a pandas DataFrame, convert this into GenomicRanges if it contains the necessary columns.

Important

The DataFrame must contain columns seqnames, starts and ends to represent genomic coordinates. The rest of the columns are considered metadata and will be available in the mcols slot of the GenomicRanges object.

from genomicranges import GenomicRanges
import pandas as pd

df = pd.DataFrame(
    {
        "seqnames": ["chr1", "chr2", "chr1", "chr3", "chr2"],
        "starts": [101, 102, 103, 104, 109],
        "ends": [112, 103, 128, 134, 111],
        "strand": ["*", "-", "*", "+", "-"],
        "score": range(0, 5),
        "GC": [random() for _ in range(5)],
    }
)

gr_from_df = GenomicRanges.from_pandas(df)
print(gr_from_df)
GenomicRanges with 5 ranges and 5 metadata columns
  seqnames    ranges          strand    score                  GC
     <str> <IRanges> <ndarray[int8]>   <list>              <list>
0     chr1 101 - 112               * |      0 0.23858456092937474
1     chr2 102 - 103               - |      1 0.22002702534410656
2     chr1 103 - 128               * |      2 0.15258582569199963
3     chr3 104 - 134               + |      3  0.7448063161314457
4     chr2 109 - 111               - |      4 0.17964849748693879
------
seqinfo(3 sequences): chr1 chr2 chr3
/opt/hostedtoolcache/Python/3.9.18/x64/lib/python3.9/site-packages/genomicranges/SeqInfo.py:348: UserWarning: 'seqnames' is deprecated, use 'get_seqnames' instead
  warn("'seqnames' is deprecated, use 'get_seqnames' instead", UserWarning)

Sequence information

The package also provides a SeqInfo class to update or modify sequence information stored in the object. Learn more about this in the GenomeInfoDb package.

from genomicranges import SeqInfo

seq = SeqInfo(
    seqnames = ["chr1", "chr2", "chr3"],
    seqlengths = [110, 112, 118],
    is_circular = [True, True, False],
    genome = "hg19",
)
gr_with_seq = gr.set_seqinfo(seq)
print(gr_with_seq)
GenomicRanges with 5 ranges and 5 metadata columns
    seqnames    ranges          strand     score                 GC
       <str> <IRanges> <ndarray[int8]>   <range>             <list>
[0]     chr1 101 - 112               * |       0 0.7012218925416509
[1]     chr2 102 - 123               - |       1 0.3590659642791052
[2]     chr3 103 - 128               * |       2 0.8513214587620568
[3]     chr2 104 - 134               + |       3 0.8310081010510505
[4]     chr3 105 - 110               - |       4  0.772390679404933
------
seqinfo(3 sequences): chr1 chr2 chr3

Getters/Setters

Getters are available to access various attributes using either the property notation or functional style.

# access sequence names
print("seqnames (as property): ", gr.seqnames)
print("seqnames (functional style): ", gr.get_seqnames())

# access all start positions
print("start positions: ", gr.start)

# access annotation information if available
gr.seqinfo

# compute and return the widths of each region
print("width of each region: ", gr.get_width()) 
# or gr.width

# access mcols
print(gr.mcols)
seqnames (as property):  ['chr1', 'chr2', 'chr3', 'chr2', 'chr3']
seqnames (functional style):  ['chr1', 'chr2', 'chr3', 'chr2', 'chr3']
start positions:  [101 102 103 104 105]
width of each region:  [11 21 25 30  5]
BiocFrame with 5 rows and 2 columns
      score                 GC
    <range>             <list>
[0]       0 0.7012218925416509
[1]       1 0.3590659642791052
[2]       2 0.8513214587620568
[3]       3 0.8310081010510505
[4]       4  0.772390679404933

Setters

Important

All property-based setters are in_place operations, with further details discussed in functional paradigm section.

modified_mcols = gr.mcols.set_column("score", range(1,6))
modified_gr = gr.set_mcols(modified_mcols)
print(modified_gr)
GenomicRanges with 5 ranges and 5 metadata columns
    seqnames    ranges          strand     score                 GC
       <str> <IRanges> <ndarray[int8]>   <range>             <list>
[0]     chr1 101 - 112               * |       1 0.7012218925416509
[1]     chr2 102 - 123               - |       2 0.3590659642791052
[2]     chr3 103 - 128               * |       3 0.8513214587620568
[3]     chr2 104 - 134               + |       4 0.8310081010510505
[4]     chr3 105 - 110               - |       5  0.772390679404933
------
seqinfo(3 sequences): chr1 chr2 chr3

or use an in-place operation:

gr.mcols.set_column("score", range(1,6), in_place=True)
print(gr.mcols)
BiocFrame with 5 rows and 2 columns
      score                 GC
    <range>             <list>
[0]       1 0.7012218925416509
[1]       2 0.3590659642791052
[2]       3 0.8513214587620568
[3]       4 0.8310081010510505
[4]       5  0.772390679404933

Access ranges

get_ranges() is a generic method to access only the genomic coordinates:

# or gr.get_ranges()
print(gr.ranges)
IRanges object with 5 ranges and 0 metadata columns
               start              end            width
    <ndarray[int32]> <ndarray[int32]> <ndarray[int32]>
[0]              101              112               11
[1]              102              123               21
[2]              103              128               25
[3]              104              134               30
[4]              105              110                5

Subset operations

You can subset a GenomicRange object using the subset ([]) operator. This operation accepts different slice input types, such as a boolean vector, a slice object, a list of indices, or names (if available) to subset.

# get the first 3 regions
gr[:3]

# get 1, 3 and 2nd rows
# note: the order is retained in the result
print(gr[[1,3,2]])
GenomicRanges with 3 ranges and 3 metadata columns
    seqnames    ranges          strand    score                 GC
       <str> <IRanges> <ndarray[int8]>   <list>             <list>
[0]     chr2 102 - 123               - |      2 0.3590659642791052
[1]     chr2 104 - 134               + |      4 0.8310081010510505
[2]     chr3 103 - 128               * |      3 0.8513214587620568
------
seqinfo(3 sequences): chr1 chr2 chr3

Iterate over ranges

You can iterate over the regions of a GenomicRanges object. name is None if the object does not contain any names. To iterate over the first two ranges:

for name, row in gr[:2]:
    print(name, row)
None GenomicRanges with 1 range and 1 metadata column
    seqnames    ranges          strand    score                 GC
       <str> <IRanges> <ndarray[int8]>   <list>             <list>
[0]     chr1 101 - 112               * |      1 0.7012218925416509
------
seqinfo(3 sequences): chr1 chr2 chr3
None GenomicRanges with 1 range and 1 metadata column
    seqnames    ranges          strand    score                 GC
       <str> <IRanges> <ndarray[int8]>   <list>             <list>
[0]     chr2 102 - 123               - |      2 0.3590659642791052
------
seqinfo(3 sequences): chr1 chr2 chr3

Intra-range transformations

For detailed description of these methods, refer to either the Bioconductor’s or BiocPy’s documentation.

  • flank: Flank the intervals based on start or end or both.
  • shift: Shifts all the ranges specified by the shift argument.
  • resize: Resizes the ranges to the specified width where either the start, end, or center is used as an anchor.
  • narrow: Narrows the ranges.
  • promoters: Promoters generates promoter ranges for each range relative to the TSS. The promoter range is expanded around the TSS according to the upstream and downstream parameters.
  • restrict: Restricts the ranges to the interval(s) specified by the start and end arguments.
  • trim: Trims out-of-bound ranges located on non-circular sequences whose length is not NA.
gr = GenomicRanges(
    seqnames=[
        "chr1",
        "chr2",
        "chr3",
        "chr2",
        "chr3",
    ],
    ranges=IRanges([x for x in range(101, 106)], [11, 21, 25, 30, 5]),
    strand=["*", "-", "*", "+", "-"],
    mcols=BiocFrame(
        {
            "score": range(0, 5),
            "GC": [random() for _ in range(5)],
        }
    ),
)

# flank
flanked_gr = gr.flank(width=10, start=False, both=True)

# shift
shifted_gr = gr.shift(shift=10)

# resize
resized_gr = gr.resize(width=10, fix="end", ignore_strand=True)

# narrow
narrow_gr = gr.narrow(end=1, width=1)

# promoters
prom_gr = gr.promoters()

# restrict
restrict_gr = gr.restrict(start=114, end=140, keep_all_ranges=True)

# trim
trimmed_gr = gr.trim()

print("GenomicRanges after the trim operation:")
print(trimmed_gr)
/opt/hostedtoolcache/Python/3.9.18/x64/lib/python3.9/site-packages/genomicranges/SeqInfo.py:405: UserWarning: 'seqlengths' is deprecated, use 'get_seqlengths' instead
  warn(
/opt/hostedtoolcache/Python/3.9.18/x64/lib/python3.9/site-packages/genomicranges/SeqInfo.py:467: UserWarning: 'is_circular' is deprecated, use 'get_is_circular' instead
  warn(
/opt/hostedtoolcache/Python/3.9.18/x64/lib/python3.9/site-packages/iranges/IRanges.py:290: UserWarning: Setting property 'width'is an in-place operation, use 'set_width' instead
  warn(
GenomicRanges after the trim operation:
GenomicRanges with 5 ranges and 5 metadata columns
    seqnames    ranges          strand     score                  GC
       <str> <IRanges> <ndarray[int8]>   <range>              <list>
[0]     chr1 101 - 112               * |       0  0.7880167331534009
[1]     chr2 102 - 123               - |       1  0.5572465235258517
[2]     chr3 103 - 128               * |       2  0.9802612319681472
[3]     chr2 104 - 134               + |       3  0.8180700845838095
[4]     chr3 105 - 110               - |       4 0.38230856580024064
------
seqinfo(3 sequences): chr1 chr2 chr3

Inter-range methods

  • range: Returns a new GenomicRanges object containing range bounds for each distinct (seqname, strand) pair.
  • reduce: returns a new GenomicRanges object containing reduced bounds for each distinct (seqname, strand) pair.
  • gaps: Finds gaps in the GenomicRanges object for each distinct (seqname, strand) pair.
  • disjoin: Finds disjoint intervals across all locations for each distinct (seqname, strand) pair.
gr = GenomicRanges(
    seqnames=[
        "chr1",
        "chr2",
        "chr3",
        "chr2",
        "chr3",
    ],
    ranges=IRanges([x for x in range(101, 106)], [11, 21, 25, 30, 5]),
    strand=["*", "-", "*", "+", "-"],
    mcols=BiocFrame(
        {
            "score": range(0, 5),
            "GC": [random() for _ in range(5)],
        }
    ),
)

# range
range_gr = gr.range()

# reduce
reduced_gr = gr.reduce(min_gap_width=3, with_reverse_map=True)

# gaps
gapped_gr = gr.gaps(start=103)  # OR
gapped_gr = gr.gaps(end={"chr1": 120, "chr2": 120, "chr3": 120})

# disjoin
disjoin_gr = gr.disjoin()

print("GenomicRanges with the disjoint ranges:")
print(disjoin_gr)
GenomicRanges with the disjoint ranges:
GenomicRanges with 5 ranges and 5 metadata columns
    seqnames    ranges          strand
       <str> <IRanges> <ndarray[int8]>
[0]     chr1 101 - 112               *
[1]     chr2 104 - 134               +
[2]     chr2 102 - 123               -
[3]     chr3 105 - 110               -
[4]     chr3 103 - 128               *
------
seqinfo(3 sequences): chr1 chr2 chr3

Set operations

  • union: Compute the union of intervals across objects.
  • intersect: Compute the intersection or finds overlapping intervals.
  • setdiff: Compute set difference.
Show the code
g_src = GenomicRanges(
    seqnames = ["chr1", "chr2", "chr1", "chr3", "chr2"],
    ranges = IRanges(start =[101, 102, 103, 104, 109], width=[112, 103, 128, 134, 111]),
    strand = ["*", "-", "*", "+", "-"]
)

g_tgt = GenomicRanges(
    seqnames = ["chr1","chr2","chr2","chr2","chr1","chr1","chr3","chr3","chr3","chr3"],
    ranges = IRanges(start =range(101, 111), width=range(121, 131)),
    strand = ["*", "-", "-", "*", "*", "+", "+", "+", "-", "-"]
)
# intersection
int_gr = g_src.intersect(g_tgt)

# set diff
diff_gr = g_src.setdiff(g_tgt)

# union
union_gr = g_src.union(g_tgt)

print("GenomicRanges after the union operation:")
print(union_gr)
GenomicRanges after the union operation:
GenomicRanges with 6 ranges and 6 metadata columns
    seqnames    ranges          strand
       <str> <IRanges> <ndarray[int8]>
[0]     chr1 106 - 232               +
[1]     chr1 101 - 231               *
[2]     chr2 102 - 226               -
[3]     chr2 104 - 228               *
[4]     chr3 104 - 238               +
[5]     chr3 109 - 240               -
------
seqinfo(3 sequences): chr1 chr2 chr3

Compute over bins

Summary stats for column

Use Pandas to compute summary statistics for a column:

pd.Series(gr.mcols.get_column("score")).describe()
count    5.000000
mean     2.000000
std      1.581139
min      0.000000
25%      1.000000
50%      2.000000
75%      3.000000
max      4.000000
dtype: float64

With a bit more magic, render a histogram using matplotlib:

import numpy as np
import matplotlib.pyplot as plt

_ = plt.hist(gr.mcols.get_column("score"), bins="auto")
plt.title("'score' histogram with 'auto' bins")
plt.show()

Not the prettiest plot but it works.

Binned average

Compute binned average for a set of query bins:

from iranges import IRanges
bins_gr = GenomicRanges(seqnames=["chr1"], ranges=IRanges([101], [109]))

subject = GenomicRanges(
    seqnames= ["chr1","chr2","chr2","chr2","chr1","chr1","chr3","chr3","chr3","chr3"],
    ranges=IRanges(range(101, 111), range(121, 131)),
    strand= ["*", "-", "-", "*", "*", "+", "+", "+", "-", "-"],
    mcols=BiocFrame({
        "score": range(0, 10),
    })
)

# Compute binned average
binned_avg_gr = subject.binned_average(bins=bins_gr, scorename="score", outname="binned_score")
print(binned_avg_gr)
/opt/hostedtoolcache/Python/3.9.18/x64/lib/python3.9/site-packages/genomicranges/SeqInfo.py:348: UserWarning: 'seqnames' is deprecated, use 'get_seqnames' instead
  warn("'seqnames' is deprecated, use 'get_seqnames' instead", UserWarning)
/opt/hostedtoolcache/Python/3.9.18/x64/lib/python3.9/site-packages/genomicranges/SeqInfo.py:348: UserWarning: 'seqnames' is deprecated, use 'get_seqnames' instead
  warn("'seqnames' is deprecated, use 'get_seqnames' instead", UserWarning)
GenomicRanges with 1 range and 1 metadata column
    seqnames    ranges          strand   binned_score
       <str> <IRanges> <ndarray[int8]>         <list>
[0]     chr1 101 - 210               * |            2
------
seqinfo(1 sequences): chr1
Tip

Now you might wonder how can I generate these bins?

Generate tiles or bins

  • tile: Splits each genomic region by n (number of regions) or by width (maximum width of each tile).
  • sliding_windows: Generates sliding windows within each range, by width and step.
gr = GenomicRanges(
    seqnames=[
        "chr1",
        "chr2",
        "chr3",
        "chr2",
        "chr3",
    ],
    ranges=IRanges([x for x in range(101, 106)], [11, 21, 25, 30, 5]),
    strand=["*", "-", "*", "+", "-"],
    mcols=BiocFrame(
        {
            "score": range(0, 5),
            "GC": [random() for _ in range(5)],
        }
    ),
)

# tiles
tiles = gr.tile(n=2)

# slidingwindows
tiles = gr.sliding_windows(width=10)
print(tiles)
GenomicRanges with 52 ranges and 52 metadata columns
     seqnames    ranges          strand
        <str> <IRanges> <ndarray[int8]>
 [0]     chr1 101 - 110               *
 [1]     chr1 102 - 111               *
 [2]     chr2 102 - 111               -
          ...       ...             ...
[49]     chr2 123 - 132               +
[50]     chr2 124 - 133               +
[51]     chr3 105 - 109               -
------
seqinfo(3 sequences): chr1 chr2 chr3

Generate tiles from genome

tile_genome returns a set of genomic regions that form a partitioning of the specified genome.

seqlengths = {"chr1": 100, "chr2": 75, "chr3": 200}

tiles = GenomicRanges.tile_genome(seqlengths=seqlengths, n=10)
print(tiles)
GenomicRanges with 30 ranges and 30 metadata columns
     seqnames    ranges          strand
        <str> <IRanges> <ndarray[int8]>
 [0]     chr1    1 - 10               *
 [1]     chr1   11 - 20               *
 [2]     chr1   21 - 30               *
          ...       ...             ...
[27]     chr3 141 - 160               *
[28]     chr3 161 - 180               *
[29]     chr3 181 - 200               *
------
seqinfo(3 sequences): chr1 chr2 chr3

Coverage

Computes number of ranges that overlap for each position.

import rich 

res_vector = gr.coverage()
rich.print(res_vector)
{
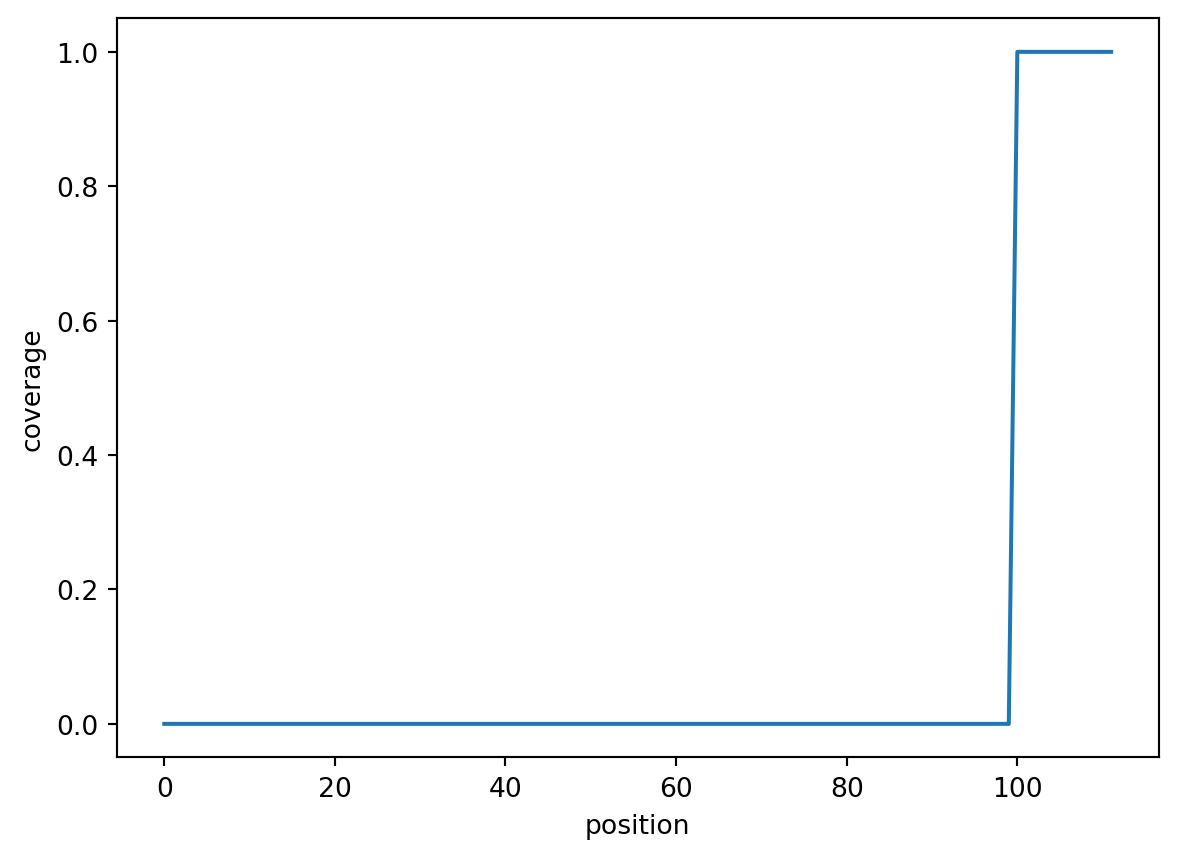
    'chr1': array([0., 0., 0., 0., 0., 0., 0., 0., 0., 0., 0., 0., 0., 0., 0., 0., 0.,
       0., 0., 0., 0., 0., 0., 0., 0., 0., 0., 0., 0., 0., 0., 0., 0., 0.,
       0., 0., 0., 0., 0., 0., 0., 0., 0., 0., 0., 0., 0., 0., 0., 0., 0.,
       0., 0., 0., 0., 0., 0., 0., 0., 0., 0., 0., 0., 0., 0., 0., 0., 0.,
       0., 0., 0., 0., 0., 0., 0., 0., 0., 0., 0., 0., 0., 0., 0., 0., 0.,
       0., 0., 0., 0., 0., 0., 0., 0., 0., 0., 0., 0., 0., 0., 0., 1., 1.,
       1., 1., 1., 1., 1., 1., 1., 1., 1., 1.]),
    'chr2': array([0., 0., 0., 0., 0., 0., 0., 0., 0., 0., 0., 0., 0., 0., 0., 0., 0.,
       0., 0., 0., 0., 0., 0., 0., 0., 0., 0., 0., 0., 0., 0., 0., 0., 0.,
       0., 0., 0., 0., 0., 0., 0., 0., 0., 0., 0., 0., 0., 0., 0., 0., 0.,
       0., 0., 0., 0., 0., 0., 0., 0., 0., 0., 0., 0., 0., 0., 0., 0., 0.,
       0., 0., 0., 0., 0., 0., 0., 0., 0., 0., 0., 0., 0., 0., 0., 0., 0.,
       0., 0., 0., 0., 0., 0., 0., 0., 0., 0., 0., 0., 0., 0., 0., 0., 1.,
       1., 2., 2., 2., 2., 2., 2., 2., 2., 2., 2., 2., 2., 2., 2., 2., 2.,
       2., 2., 2., 2., 1., 1., 1., 1., 1., 1., 1., 1., 1., 1., 1.]),
    'chr3': array([0., 0., 0., 0., 0., 0., 0., 0., 0., 0., 0., 0., 0., 0., 0., 0., 0.,
       0., 0., 0., 0., 0., 0., 0., 0., 0., 0., 0., 0., 0., 0., 0., 0., 0.,
       0., 0., 0., 0., 0., 0., 0., 0., 0., 0., 0., 0., 0., 0., 0., 0., 0.,
       0., 0., 0., 0., 0., 0., 0., 0., 0., 0., 0., 0., 0., 0., 0., 0., 0.,
       0., 0., 0., 0., 0., 0., 0., 0., 0., 0., 0., 0., 0., 0., 0., 0., 0.,
       0., 0., 0., 0., 0., 0., 0., 0., 0., 0., 0., 0., 0., 0., 0., 0., 0.,
       1., 1., 2., 2., 2., 2., 2., 2., 1., 1., 1., 1., 1., 1., 1., 1., 1.,
       1., 1., 1., 1., 1., 1., 1., 1., 1.])
}

Lets see what the coverage looks like, now with seaborn:

import seaborn as sns
vector = res_vector["chr1"]
sns.lineplot(data=pd.DataFrame({
    "position": [i for i in range(len(vector))], 
    "coverage":vector
}), x ="position", y="coverage")

I guess that looks ok. :) but someone can help make this visualization better. (something that ports plotRanges from R)

Overlap based methods

  • find_overlaps: Find overlaps between two GenomicRanges objects.
  • count_overlaps: Count overlaps between two GenomicRanges objects.
  • subset_by_overlaps: Subset a GenomicRanges object if it overlaps with the ranges in the query.
subject = GenomicRanges(
    seqnames= ["chr1","chr2","chr2","chr2","chr1","chr1","chr3","chr3","chr3","chr3"],
    ranges=IRanges(range(101, 111), range(121, 131)),
    strand= ["*", "-", "-", "*", "*", "+", "+", "+", "-", "-"],
    mcols=BiocFrame({
        "score": range(0, 10),
    })
)

df_query = pd.DataFrame(
    {"seqnames": ["chr2",], "starts": [4], "ends": [6], "strand": ["+"]}
)

query = GenomicRanges.from_pandas(df_query)

# find Overlaps
res = subject.find_overlaps(query, query_type="within")

# count Overlaps
res = subject.count_overlaps(query)

# subset by Overlaps
res = subject.subset_by_overlaps(query)

print(res)
GenomicRanges with 0 ranges and 0 metadata columns
seqinfo(3 sequences): chr1 chr2 chr3
/opt/hostedtoolcache/Python/3.9.18/x64/lib/python3.9/site-packages/genomicranges/SeqInfo.py:348: UserWarning: 'seqnames' is deprecated, use 'get_seqnames' instead
  warn("'seqnames' is deprecated, use 'get_seqnames' instead", UserWarning)
/opt/hostedtoolcache/Python/3.9.18/x64/lib/python3.9/site-packages/genomicranges/SeqInfo.py:348: UserWarning: 'seqnames' is deprecated, use 'get_seqnames' instead
  warn("'seqnames' is deprecated, use 'get_seqnames' instead", UserWarning)

Search operations

  • nearest: Performs nearest neighbor search along any direction (both upstream and downstream).
  • follow: Performs nearest neighbor search only along downstream.
  • precede: Performs nearest neighbor search only along upstream.
find_regions = GenomicRanges(
    seqnames= ["chr1", "chr2", "chr3"],
    ranges=IRanges([200, 105, 1190],[203, 106, 1200]),
)

query_hits = gr.nearest(find_regions)

query_hits = gr.precede(find_regions)

query_hits = gr.follow(find_regions)

print(query_hits)
[[0], [], [2]]
Note

Similar to IRanges operations, these methods typically return a list of indices from subject for each interval in query.

Comparison, rank and order operations

  • match: Element-wise comparison to find exact match intervals.
  • order: Get the order of indices for sorting.
  • sort: Sort the GenomicRanges object.
  • rank: For each interval identifies its position is a sorted order.
# match
query_hits = gr.match(gr[2:5])
print("matches: ", query_hits)

# order
order = gr.order()
print("order:", order)

# sort
sorted_gr = gr.sort()
print("sorted:", sorted_gr)

# rank
rank = gr.rank()
print("rank:", rank)
matches:  [[2], [3], [4]]
order: [0 1 3 4 2]
sorted: GenomicRanges with 5 ranges and 5 metadata columns
    seqnames    ranges          strand    score                  GC
       <str> <IRanges> <ndarray[int8]>   <list>              <list>
[0]     chr1 101 - 112               * |      0 0.11557928506866144
[1]     chr2 102 - 123               - |      1 0.20177779058567846
[2]     chr2 104 - 134               + |      3 0.14217179647858091
[3]     chr3 105 - 110               - |      4   0.607670492529722
[4]     chr3 103 - 128               * |      2  0.7871210406771436
------
seqinfo(3 sequences): chr1 chr2 chr3
rank: [0, 1, 4, 2, 3]

Combine GenomicRanges objects by rows

Use the combine generic from biocutils to concatenate multiple GenomicRanges objects.

from biocutils.combine import combine
a = GenomicRanges(
    seqnames=["chr1", "chr2", "chr1", "chr3"],
    ranges=IRanges([1, 3, 2, 4], [10, 30, 50, 60]),
    strand=["-", "+", "*", "+"],
    mcols=BiocFrame({"score": [1, 2, 3, 4]}),
)

b = GenomicRanges(
    seqnames=["chr2", "chr4", "chr5"],
    ranges=IRanges([3, 6, 4], [30, 50, 60]),
    strand=["-", "+", "*"],
    mcols=BiocFrame({"score": [2, 3, 4]}),
)

combined = combine(a,b)
print(combined)
GenomicRanges with 7 ranges and 7 metadata columns
    seqnames    ranges          strand    score
       <str> <IRanges> <ndarray[int8]>   <list>
[0]     chr1    1 - 11               - |      1
[1]     chr2    3 - 33               + |      2
[2]     chr1    2 - 52               * |      3
[3]     chr3    4 - 64               + |      4
[4]     chr1    3 - 33               - |      2
[5]     chr2    6 - 56               + |      3
[6]     chr3    4 - 64               * |      4
------
seqinfo(5 sequences): chr1 chr2 chr3 chr4 chr5

Misc operations

  • invert_strand: flip the strand for each interval
  • sample: randomly choose k intervals
# invert strand
inv_gr = gr.invert_strand()

# sample
samp_gr = gr.sample(k=4)

GenomicRangesList class

Just as it sounds, a GenomicRangesList is a named-list like object.

If you are wondering why you need this class, a GenomicRanges object enables the specification of multiple genomic elements, usually where genes start and end. Genes, in turn, consist of various subregions, such as exons. The GenomicRangesList allows us to represent this nested structure.

As of now, this class has limited functionality, serving as a read-only class with basic accessors.

from genomicranges import GenomicRangesList
a = GenomicRanges(
    seqnames=["chr1", "chr2", "chr1", "chr3"],
    ranges=IRanges([1, 3, 2, 4], [10, 30, 50, 60]),
    strand=["-", "+", "*", "+"],
    mcols=BiocFrame({"score": [1, 2, 3, 4]}),
)

b = GenomicRanges(
    seqnames=["chr2", "chr4", "chr5"],
    ranges=IRanges([3, 6, 4], [30, 50, 60]),
    strand=["-", "+", "*"],
    mcols=BiocFrame({"score": [2, 3, 4]}),
)

grl = GenomicRangesList(ranges=[a,b], names=["gene1", "gene2"])
print(grl)
GenomicRangesList with 2 ranges and 2 metadata columns
 
Name: gene1 
GenomicRanges with 4 ranges and 4 metadata columns
    seqnames    ranges          strand    score
       <str> <IRanges> <ndarray[int8]>   <list>
[0]     chr1    1 - 11               - |      1
[1]     chr2    3 - 33               + |      2
[2]     chr1    2 - 52               * |      3
[3]     chr3    4 - 64               + |      4
------
seqinfo(3 sequences): chr1 chr2 chr3
 
Name: gene2 
GenomicRanges with 3 ranges and 3 metadata columns
    seqnames    ranges          strand    score
       <str> <IRanges> <ndarray[int8]>   <list>
[0]     chr2    3 - 33               - |      2
[1]     chr4    6 - 56               + |      3
[2]     chr5    4 - 64               * |      4
------
seqinfo(3 sequences): chr2 chr4 chr5
 

Properties

grl.start
grl.width
{'gene1': array([10, 30, 50, 60], dtype=int32),
 'gene2': array([30, 50, 60], dtype=int32)}

Combine GenomicRangeslist object

Similar to the combine function from GenomicRanges,

grla = GenomicRangesList(ranges=[a], names=["a"])
grlb = GenomicRangesList(ranges=[b, a], names=["b", "c"])

# or use the combine generic
from biocutils.combine import combine
cgrl = combine(grla, grlb)

The functionality in GenomicRangesLlist is limited to read-only and a few methods. Updates are expected to be made as more features become available.

Empty ranges

Both of these classes can also contain no range information, and they tend to be useful when incorporates into larger data structures but do not contain any data themselves.

To create an empty GenomicRanges object:

empty_gr = GenomicRanges.empty()

print(empty_gr)
GenomicRanges with 0 ranges and 0 metadata columns

Similarly, an empty GenomicRangesList can be created:

empty_grl = GenomicRangesList.empty(n=100)

print(empty_grl)
GenomicRangesList with 100 ranges and 100 metadata columns
--- empty genomic ranges list ---

Futher reading